Measuring Your Home Network
In my last post, I described public datasets for understanding equity in Internet access. It is also useful to be able to measure connections directly. This will allow us to roll out tests in specific sets of households, and measure the network parameters that are necessary in the “real world.”
I will divide these measurements into three “bins”:
- Basic parameters, like bandwidth and latency, that can be measured by active tests
- Consumption, which entails larger technical challenges and merits its own post, and
- Application performance, measured either through objective measures like video resolution or subjective ones like human-perceived video quality.
This post focuses on the first group. I will first describe a few of these measurements: why they matter and how to run them. The post is technical, but aside from the code, most of the first half should be readable for people interested in Internet policy. The second part describes a few more steps, that a technically-oriented reader might follow to wrap up the tests and run them at home.
Measurements
Bandwidth
For most consumers and policymakers the first (and only) question is: “how fast is the connection?” Formally, this is the network bandwidth, and of course it has an upstream and downstream component. This is measured in megabits per second (Mbps), and the usual threshold for basic broadband is “25/3” (25 Mbps down, 3 Mbps up).
The upstream and downstream links are usually quite asymmetric, with more download than upload. The technical reasons for this relate to the coordination of signals in each direction (the telecom company can pack outgoing data efficiently, but you and your neighbors can’t do the same) and the high interference incumbent in data centers on strong outgoing but weak incoming signals. The asymmetry also reflects the “traditional patterns” of use (more people watch TV than run their own studios). And there’s probably some hysteresis in the pricing.
In addition to incoming and outgoing signals, we should also distinguish performance on different protocols. Two common internet transport protocols are TCP (Transport Control Protocol) and UDP (User Datagram Protocol). The practical difference is that TCP ensures data delivery whereas UDP does not. TCP is thus used for things like files and web resources whereas UDP is used for video and voice, that have high bandwidth demands but are tolerant to some loss. (A video with a missing frame is still watchable.) So we should test both uploads and downloads, and both TCP and UDP.
TCP/Speedtest
For TCP bandwidth, we’ll take Ookla Speedtest as the gold standard. (Full disclosure, since we like Ookla’s data at DSI, we are working on licensing it for our work.) You can run the speedtest online, but there’s also a command line tool and indeed a python library. We can install these via
$ pip install speedtest-cli
$ sudo apt install speedtest-cli
and run them from the CLI as
$ speedtestor in a script as
from speedtest import Speedtest

s = Speedtest()
s.get_best_server()
s.download()
s.upload()
s.results.dict()
By default, this will run the test on the closest (lowest-ping) server on Ookla’s network. You can then retrieve download and upload elements from the dictionary (as well as latency and jitter).
UDP / iperf3
For UDP bandwidth, I love iperf3: it is incredibly configurable and easy to use. It does require a remote server with a pretty beefy and reliable connection. Fortunately, the University provides that.
First $ apt install iperf3 on each machine. Then start the remote server (-s) as a daemon (-D) on port 12345 (-p):
$ iperf3 -s -D -p 12345and call it from home:
$ iperf3 -c my_remote.io -p 12345 -b 30M -R -u -i 0I am thus accessing host my_remote.io as a client (-c) on port (-p) 12345. I’m running a test with bandwidth (-b) of 30 Mbps in the “reversed” direction (-R) from the server to me i.e. a download, using UDP (-u) and by the way I don’t want the reports at regular intervals (-i 0).
You could also test uploads (drop the -R) or TCP (no -u). For TCP tests at high bandwidth you may need to set multiple parallel streams (-P 10, say) to saturate the link. You’ll need to run the test with a bandwidth that you expect will exceed what your ISP provisions. Keep in mind that this test does use data. Though it’s not much, it’s also not something you want to schedule every minute: that would consume your monthly 1.2TB allowance with Comcast.
Latency
The latency is just “how long” it takes for something to arrive. For example, if you own your own satellite, you may be able to achieve high bandwidth, but your latency will remain long. Your data literally has to go to Space and back, and even light (electromagnetic waves) takes a while to do that.
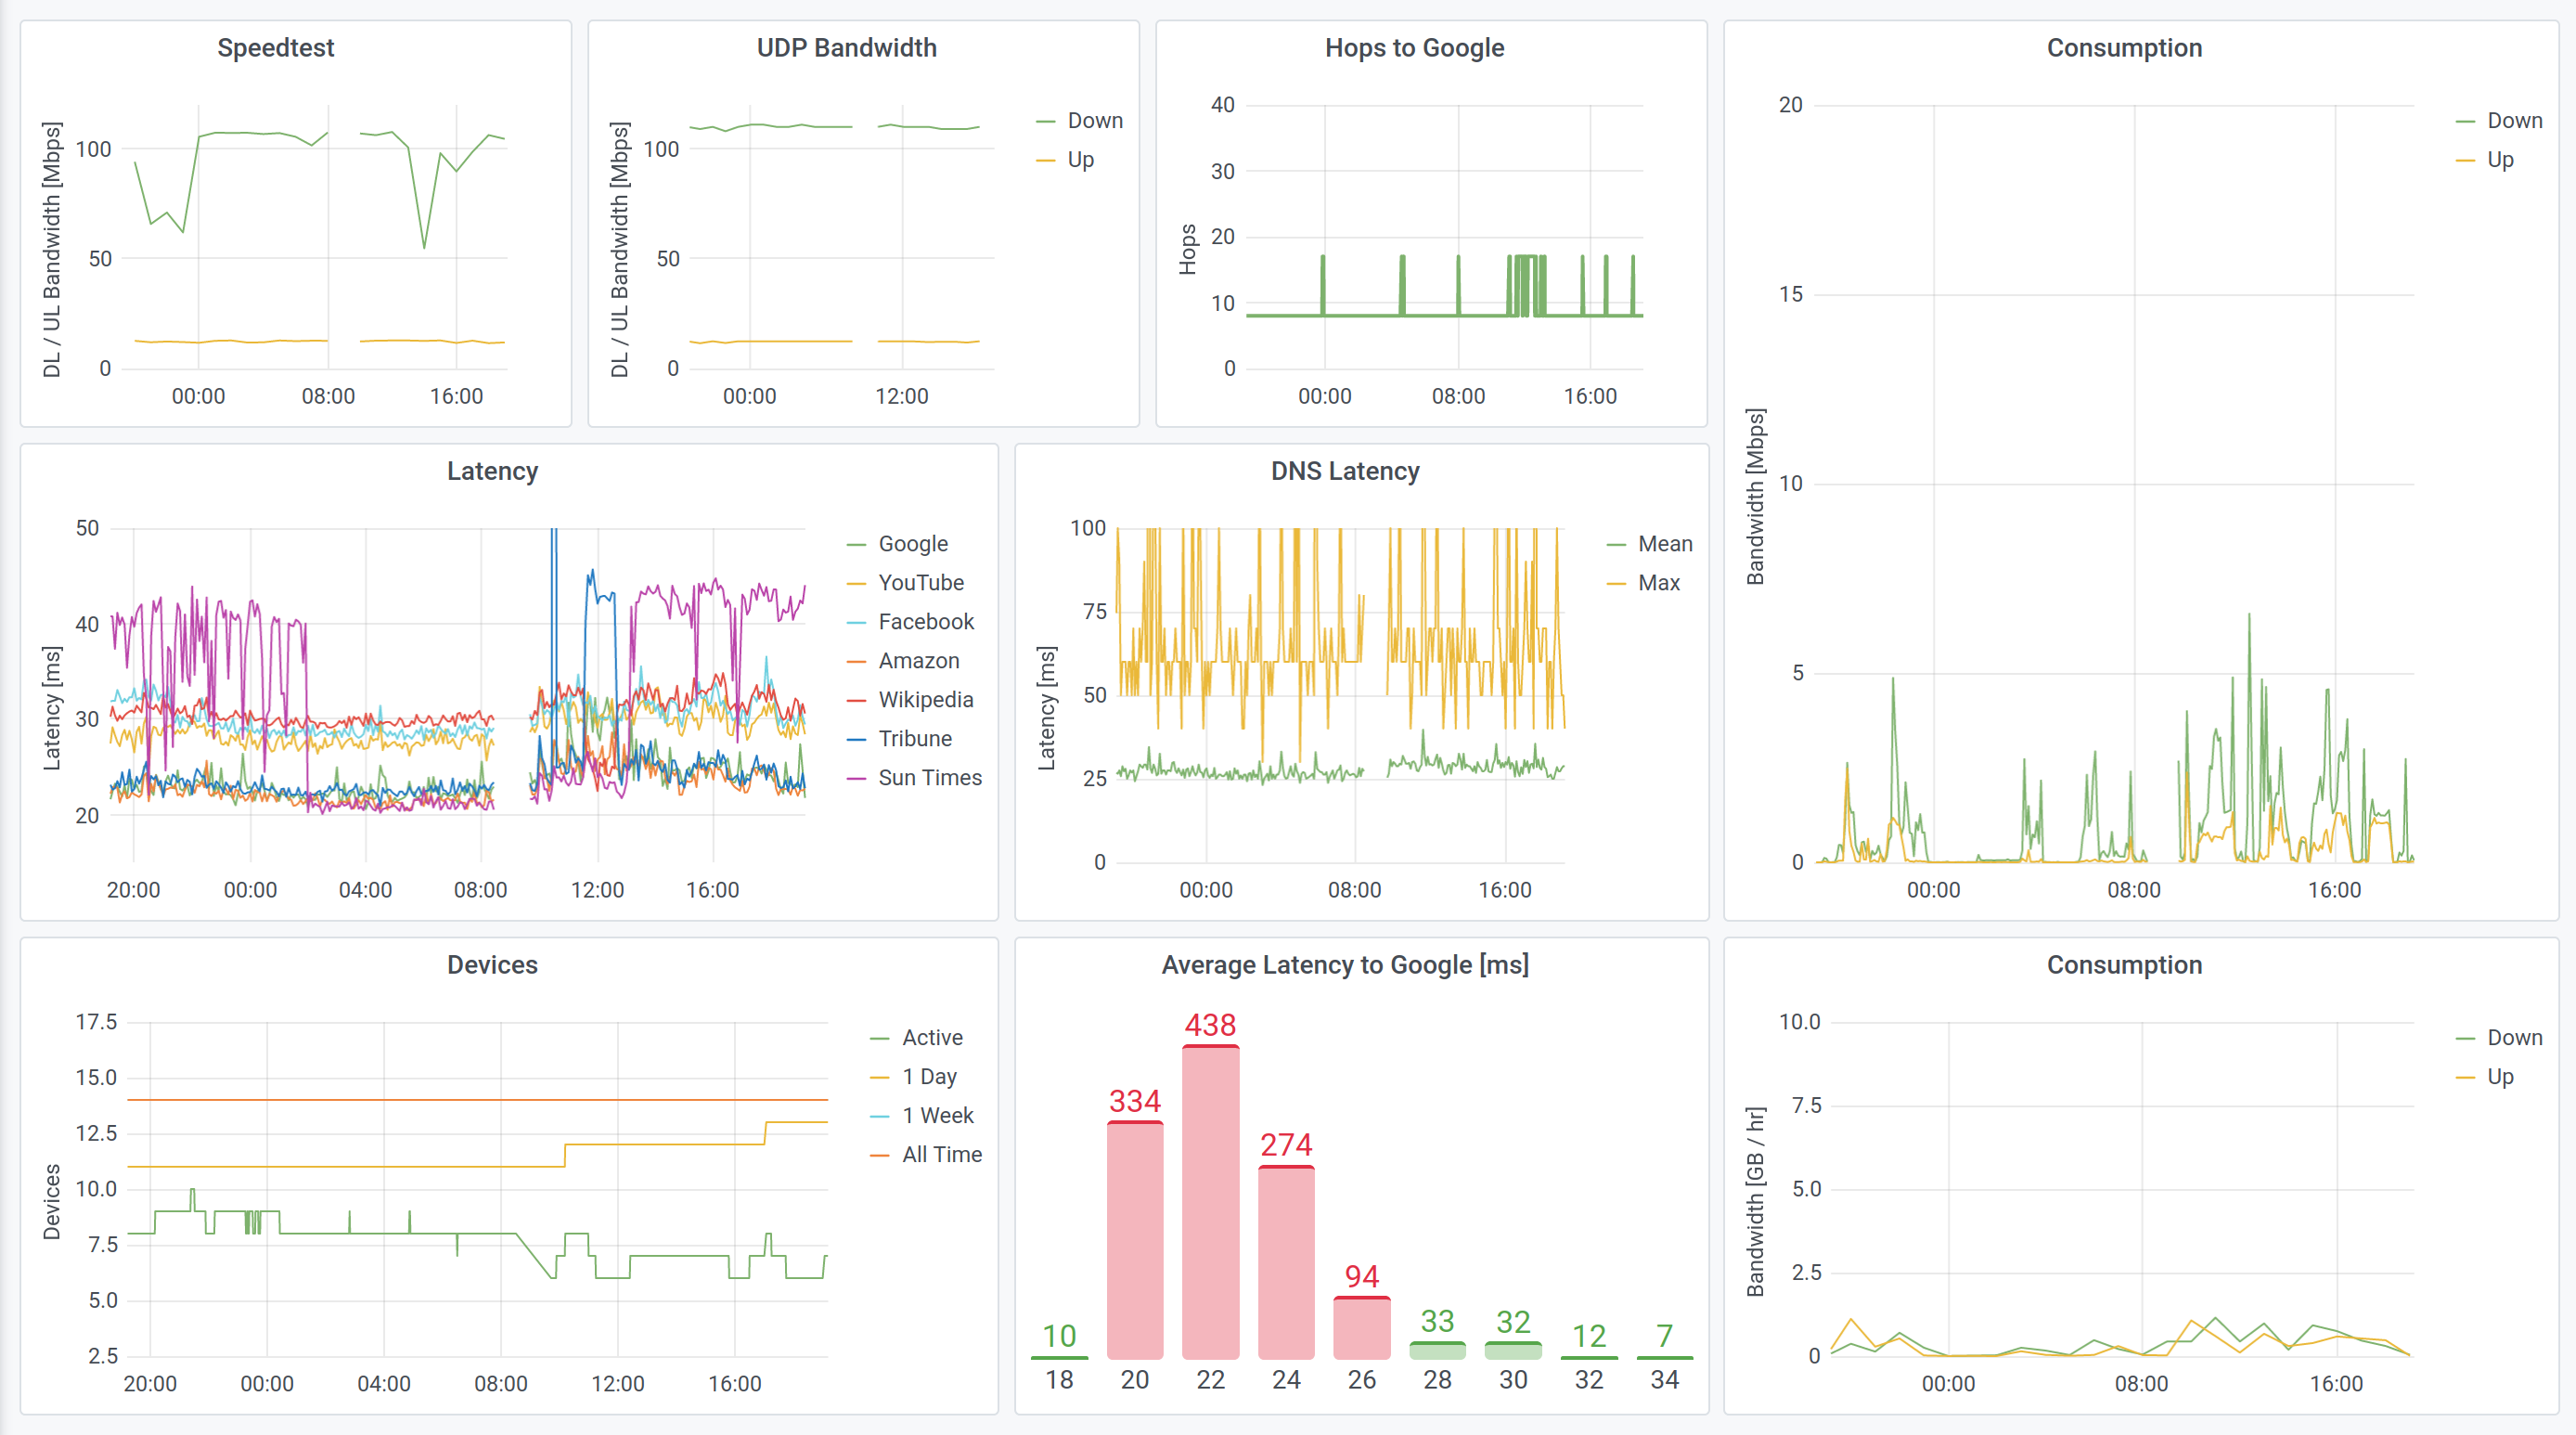
Typical latencies are tens of milliseconds. In Chicago, Content Distribution Networks (CDNs) and co-hosting of services places most resources just 8 ms away from me. Google and Netflix foist their servers on ISPs, while the Chicago Tribune uses Akamai to distribute content and the Sun Times uses fastly. Those servers are probably almost in my neighborhood. But Wikipedia and Amazon take a little longer – 30 ms or so – and indeed you can geolocate the servers on the West Coast. If I visit my in-laws’ in rural Ohio, no major service is less than 22 ms away.
At any rate, these delays are short enough that you mostly don’t experience delays in browsing, due to latency. We’ll measure two types of latency: ping and DNS. You could test others, however, like the time for a simple web handshake (i.e., an HTTP GET request).
ICMP Echo Request / ping
The first latency is the round trip time (RTT) to a server and back. Almost anyone who has touched the command line knows this as a ping, and it has entered the common lexicon (“I’ll ping you”). It is the way most technically-oriented people check if they’re connected to the Internet connection (ping google.com). Technically, I’ll use the standard ICMP instead of UDP ping. But I’ll use a few extra options than usual:
$ ping -c 10 -i 0.25 -w 5 -q google.comThis means that I want to pack 10 requests (-c, count) to Google, back to back with an interval (-i) of just 0.25 seconds between them. I don’t want to wait more than 5 seconds (-w) for any packet, and I don’t want the customary report on each packet (-q, quiet). I just want those juicy last lines that tell me the RTT:
--- google.com ping statistics ---
10 packets transmitted, 10 received, 0% packet loss, time 2259ms
rtt min/avg/max/mdev = 24.270/32.479/41.457/5.210 ms
To really test my connection, I like to use a variety of common services: Google and Youtube, Facebook, Amazon, Wikipedia, newspapers (the Tribune and the Sun Times), and the University where I work. Careful that not all services respond to pings. Netflix doesn’t and neither does www.uchicago.edu; in that case I use the CS department.
DNS Latency / dig
When you access a webpage, you need to know where it is. Unfortunately, nytimes.com is a great mnemonic, but not a real location. Your computer looks this up for you “on the fly” in the Domain Name System. For example, the New York Times lives on the fastly distribution network at 151.101.1.164, although it doesn’t display from that address.
The time that it takes your computer to perform this lookup is called the DNS latency, and it’s easy to measure with dig or nslookup:
$ dig nytimes.comThe very big warning with DNS latencies is that “caches” abound. What this means is that your computer, and your home router, and your local ISP, may all decline to forward your lookup and respond instead, “hey, I’ve seen that request before!! I know I’ve got it in cache somewhere here…” So most of the time, your computer will find someone with the answer without going all the way to Cloudflare (1.1.1.1), Google (8.8.8.8), or your ISP (74.74.74.74, in my case). Because of these caches, there is a very real ambiguity in what you want to measure: do you want to measure the time it takes to reach the server, or the time it usually takes for your computer to get an answer? The latter is often “0,” so if you want a non-trivial answer, you’ll have to do something like:
$ dig @8.8.8.8 nytimes.comto force dig to make its way all the way to Google (in this case).
Note that one might want to run these explicitly in the “classical” and “modern” IP spaces (IPv4 and IPv6). There are also python libraries for DNS lookups, like getdns or dnspython, but I did not find them to facilitate things greatly, in this application.
Hops to the Internet / traceroute
Latencies measure the time it takes to reach another server; we could also check this “topologically.” How many steps does it take to reach some resource? If a network is poorly configured or has bad “peering” agreements with other networks, it might take many “hops” for you to reach your destination, and you might experience poor performance. Think of an airplane journey with 12 layovers.
This really can happen. For example, if I try to reach CERN (the European Laboratory for Particle Physics, where I used to work) the path is very different if I start from the University versus home. The path from the University travels along a dedicated high-throughput link sponsored by the Department of Energy to Brookhaven National Lab on Long Island. On the other hand, Comcast sends my request from home through a commercial pathway, through the Google carrier hotels in NYC.
You can measure this via a program called traceroute. The design of traceroute is very elegant: it works by requesting a resource repeatedly with different time-to-live (TTL) settings. Roughly speaking, it first asks the Internet, “please find my target within 1 step!” And the Internet tries and of course, it fails, but it reports the location of that one-step failure. Now traceroute records the location of that first step, and it asks “please find my target within 2 steps!” which likewise fails but reports the location of the second step. This continues until the resource is reached, building out the path.
In a test setup, I run this as
$ traceroute -m 15 -N 32 -w3 lxplus.cern.chMeaning, take up to a maximum of (-m) of 15 steps, with up to 32 attempts at a time (-N, number) waiting (-w) for up to 3 seconds to hear back on each, and targeting the lxplus login nodes at CERN.
Note that even fewer servers take the trouble to respond to traceroute than ping (lxplus does not). In certain applications, I may be more interested in the beginning of a traceroute than the final path to a single resource. Depending on what I know about a path, I may stop the traceroute before it terminates. For instance, I may want to know the number of steps to the “backbone” of the Internet. Traceroutes starting on Comcast in Chicago almost all pass through Comcasts’ ibone nodes on the way out, so I tack on | grep -m 1 ibone to truncate the requests as soon as they reach the exit.
Devices
Internet equity is more than speed. Another important facet is how people use the Internet, and the diversity and appropriateness of devices that they use to connect to it. My home network sees about a dozen devices each a day (my in-laws tend to my son), and the network has seen 16 unique devices since I started recording. One person uses multiple laptops (guess who) and everyone except that person has a smartphone. There are Chromecasts, a printer, several Kindles, and so on.
Other households may see far fewer devices, and those devices may be more or less appropriate for online work or school. For instance, my wife uses her laptop to teach, and her phone just wouldn’t cut it for that purpose. For most people, both devices are necessary.
Counting devices on a network can be done in a number of ways. The router itself knows of course, and it may be able to tell you directly. For example, my Netgear Nighthawk router exposes an API that can report its settings, the number of devices, and even consumption over time (depending on how the router is configured). The Turris Omnia is an OpenWRT router aka Linux box with command-line access to the wireless interface.
But even without that level of access, we can get the information from the router. One way to do this is just literally look for a device at every address on the local network. We can do that using nmap (which you may have to install):
$ nmap -sn 192.168.1.0/24This runs a ping scan (-sn) of all 256 addresses (last byte of the address) in 192.168.1.0, assuming that your router’s address is 192.168.1.1 instead of like 10.0.0.1.
Once you’ve done that, you can just retrieve the list of addresses from cache, using the arp tool
$ arp -i eth0 -ewhere -i eth0 restricts the report to the Ethernet interface, and -e just specifies the output format. This will show all of the connected devices.
Web Performance
Ultimately what matters is not the technical parameters of the Internet, but how it works for people. Measuring users’ “Quality of Experience” (QoE) is a vast problem, but we can make a very first stab at it by recording the time it takes to load common web pages – a sort of “human” latency.
Of course, we don’t want to actually visit the pages, so we can just ask Chrome to do it in “headless” mode (no window) using the selenium python package to direct the chromium-chromedriver “browser,” which you’ll need to install:
$ sudo apt install chromium-chromedriver
$ pip3 install selenium
Timing a page-load time for the New York Times python is then as simple as
from selenium import webdriver

options = webdriver.ChromeOptions()
options.add_argument("window-size=1200x600")
options.add_argument("headless")
driver = webdriver.Chrome(options = options)

start = time.time()
driver.get("https://www.nytimes.com/")
end   = time.time()
In other words, create the browser, set its options (and make it headless!) and then just measure the load time!
Consumption
Just as for the number of devices, real equity in Internet access is not just about the presence or absence of a connection, but how we access and use the resource. I suspect that consumption patterns – data volume, schedules, devices, resources – differ dramatically between homes. This involves huge and critical privacy issues that I won’t broach here, but we do want to measure this.
Consumption and application performance are technically somewhat more involved than the measurements already listed. The issue is that you need to get in the way of traffic – you need to see it to measure it. There are at least four ways of doing this, using (1) wired hardware (a mirroring switch), (2) wireless hardware (packet sniffing), (3) software (arp spoofing), or (4) the router itself (if you can access it). I will save the details for the next post.
If you’re just interested in Internet performance for policy, the post ends here – or you could stop by SamKnows. But if you want to try these in your home, read on!
Scheduling and Logging Tests
I have wrapped the tests described above in a little python script, which you can find on GitHub.
To run these tests regularly and reliably, you’ll need device with a wired Ethernet connection to the router. The Ethernet connection is important: we don’t want to measure the latency or interference or other artifacts of the Wifi interface. In practice I used a raspberry pi, though it could be a jetson nano or the router itself. Most Linux OSes will work fine. I used Ubuntu Server 20.04 which turned out to be a little bit of extra complication, and pi OS was easier. This post assumes that you have such a machine, but I’ve also written detailed instructions for this.
In order to run the tests at regular intervals, we can use cron jobs to schedule them. The crontab task schedule has three lines. Every minute except the half hours, we run the tests for ping, DNS, device counts, hop count, and consumption.
# m          h  dom mon dow   command
 3-29,33-59  *   *   *   *     /home/me/netrics/net_measures.py -p -d -n -t -c
And every other hour on the hour, we run the speedtest and render tests:
0 */2 * * * /home/me/netrics/net_measures.py -s -rwhile the iperf3 UDP test runs on the half hours:
30 */2 * * * /home/me/netrics/net_measures.py -i -rAs for the dashboard, Guilherme Martins at CDAC suggested influx and grafana for logging and visualizing. I think this was great advice (influx in particular). When I went to use it, I discovered that the influx/grafana stack is a classic of DIY home IoT projects, including for speedtest logging in particular (1, 2, 3, 4)!
The script thus completes by forwarding its data to influx cloud:
from netrc import netrc
from influxdb import InfluxDBClient
from influxdb_client.client.write_api import SYNCHRONOUS

influx_url = "https://us-east-1-1.aws.cloud2.influxdata.com/"
influx_orgID, _, influx_token = netrc().authenticators("influx")
influx_client = InfluxDBClient(url = influx_url, orgID = influx_orgID,
                               token = influx_token)
influx_write = influx_client.write_api(write_options = SYNCHRONOUS).write

influx_write("my_bucket", "my_org", ## bucket / org
             [{"measurement": "networks",
               "tags": {"install": "installation_location"},
               "fields": measurements,
               "time" : datetime.utcnow()
             }])
At first, I pushed to the free tier of Influx Cloud (data expires after 30 days), and then also pushed to the DB and Grafana instance that Guilherme was running for the group.
At this point, we can configure dashboards to our hearts’ content, or just hang on to the data for future analysis. The dashboards that we can make with InfluxCloud or grafana are very similar, but each has its strengths. Grafana includes support for legends, while InfluxCloud offers native histograms (!) and allows for different time spans on different plots. The grafana version is shown below.